Canada's FDI numbers: 3 questions, 3 perspectives
With the release of Canada’s foreign direct investment (FDI) numbers, Invest in Canada presents additional perspective on what’s behind the numbers.
Statistics Canada’s report for the first quarter (Q1) of 2020 indicates FDI inflow for the period is $13.1B CAD. For comparison, in 2019, Q1 results were $12.4B, which reflects an increase of 5.4% in Q1 of 2020.
If you’ve yet to read Invest in Canada CEO Ian McKay’s article in which he reviews the overall context of the current global investment results, you’re encouraged to do so first.
Answering three questions about the Q1 FDI results are Invest in Canada’s Chief Executive Officer Ian McKay; Chief, Investor Services Nathalie Béchamp; and Chief Information Officer Issie Berish.
Question #1: What kind of global direct investment activity do these Q1 numbers reflect?
Ian G. McKay, Chief Executive Officer, Invest in Canada responds:
In drilling down deeper and comparing first quarter FDI results for 2020 compared to those in the same period last year, perhaps the biggest difference is in the mergers and acquisitions (M&As) category.
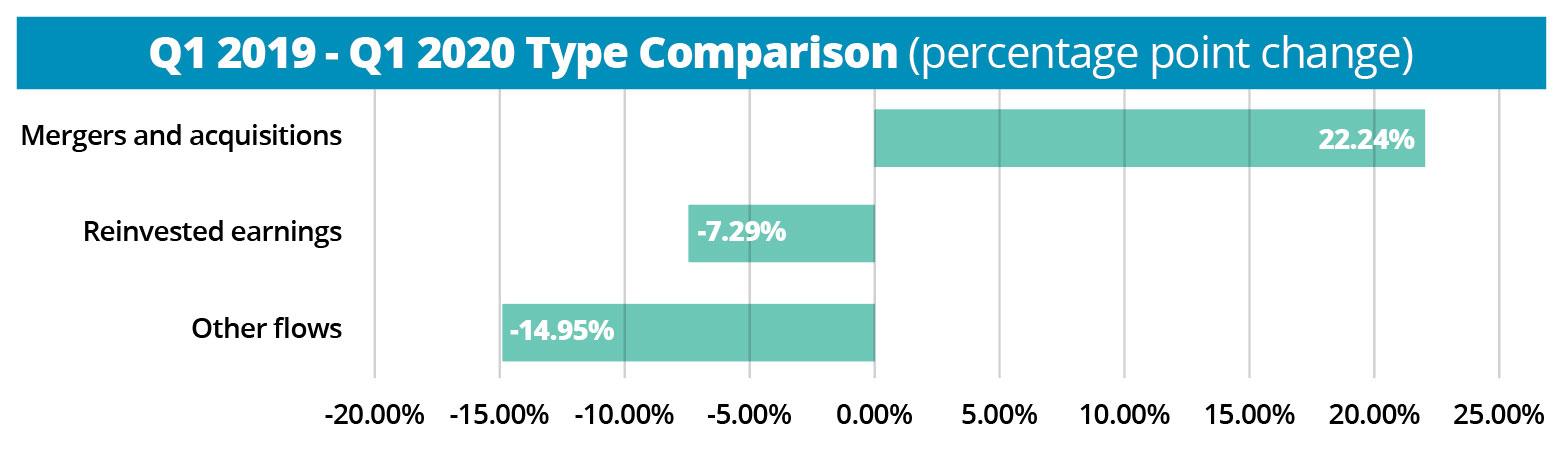
While M&A activity represents, at 26.1%, the smallest portion of FDI investment by type (Reinvested earnings takes the top spot at 46.2%, while Other flows takes 27.7%), mergers and acquisitions grew by $2.9B, or 22.2%, compared to last year’s Q1 period.
This gain in M&A activity could be attributed to large deals effective this quarter that are bringing investment dollars into Canada. Three deals—HBC in the retail sector, Airbus in the aerospace sector, and Continental Gold in the mining sector—each exceeded $500 million.
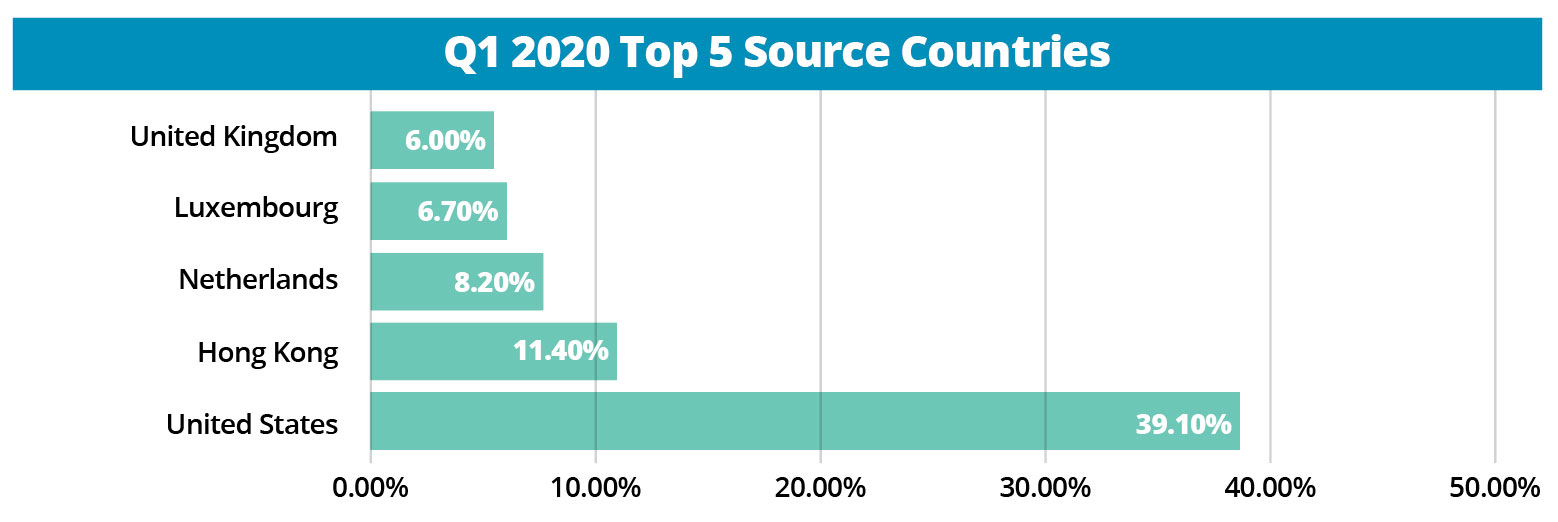
Switching gears to source countries, the United States stays on top with 39.1% of FDI flows, followed by Hong Kong (11.4%), Netherlands (8.2%), Luxembourg (6.7%), and the United Kingdom (6%).
When we look at the change in source country share between Q1 2019 and Q1 2020, Hong Kong nudged out the United States for the greatest change (a 10.1 percentage point increase). The dollar value increases for both source countries were similar, at around $1.3B each.
There are other interesting dimensions behind these Q1 numbers worth exploring. I’ll let Nathalie Béchamp, our Chief, Investor Services present some of that analysis.
I’ll conclude here by reiterating that although Q1’s modest increase in FDI is positive, we have yet to see the full effect of COVID-19 on FDI. We fully expect to see a decrease in FDI in Q2. And it remains to be seen what that number will be. We’ll be following activity and indicators closely.
Question #2: How much activity is happening in global direct investment these days, given the COVID-19 pandemic?
Nathalie Béchamp, Chief, Investor Services, Invest in Canada responds:
As the Q1 numbers reported yesterday reveal—$13.1 billion in FDI for the period, representing a 5% increase from last year’s first quarter results—there is still a lot of FDI activity occurring in Canada, even in the midst of this pandemic.
This activity reflects global investments into Canada that are occurring all throughout Canada—in all kinds of companies, in all different sectors.
For Q1 2020, the top three industry sectors in which we see global investment in Canada are Management of companies and enterprises (28.6% of total flows), Manufacturing (28.5%) and Trade and Transportation (24.3%).
Those three industry sectors represented over 80% of FDI activity in Q1 2020. Finance and Insurance, Energy and Mining, and Other industries make up the remaining 18.6%.
Looking closer at the changes from Q1 2019, Manufacturing lost 36.3 percentage points from its share of FDI flows, while Management of companies made a substantial gain (an increase of 27.3 percentage points) and Trade and transportation made an even more substantial gain (an increase of 30.8 percentage points).
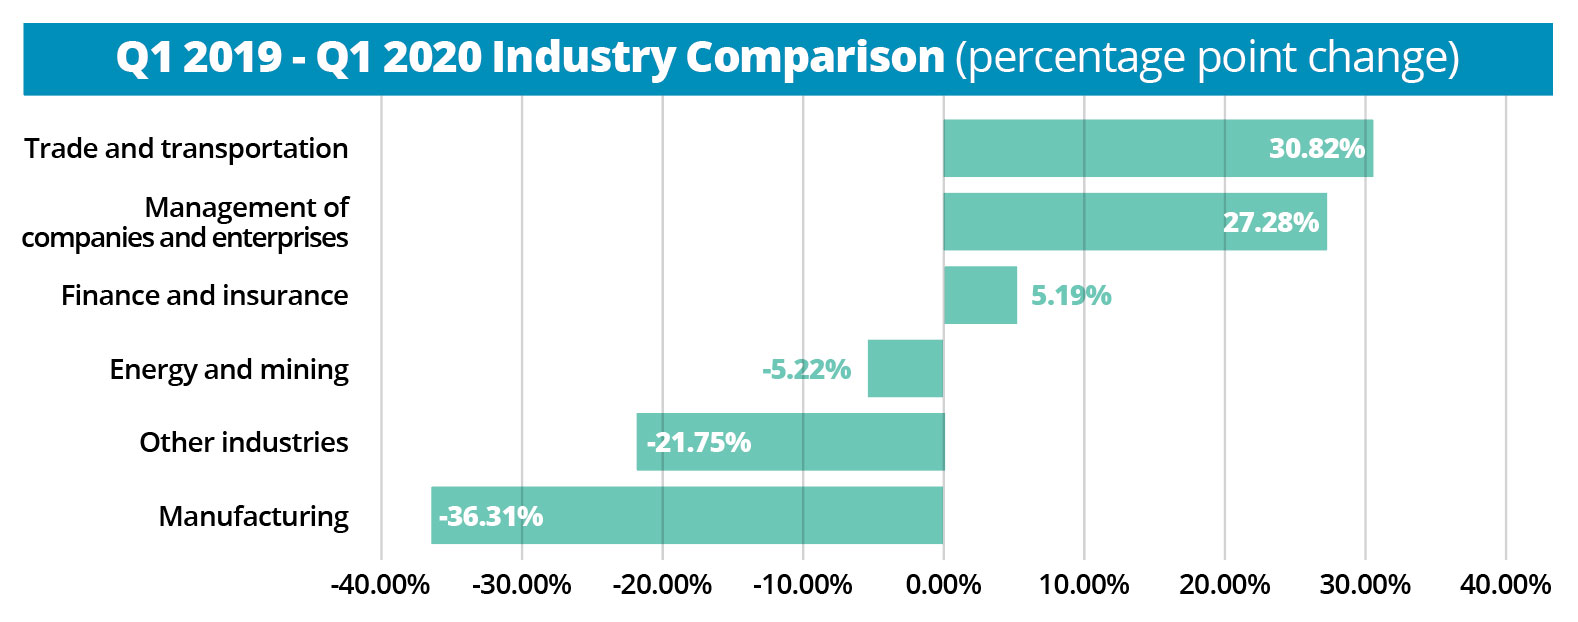
The combined dollar value growth of $7.6B from Trade and transportation / Management of companies more than offset the $7B loss from Manufacturing and Other industries.
Looking ahead to Q2, with COVID-19-related decreases in FDI anticipated all over the world, we fully expect to see such decreases here as well. We will then see more clearly how the pandemic is affecting FDI from sector to sector.
Question #3: What is the process of arriving at these FDI numbers in the midst of the COVID-19 pandemic?
Issie Berish, Chief Information Officer, Invest in Canada responds:
It’s good to start with a perspective on the timing of these numbers. Among the many different economic indicators on which Statistics Canada reports, every three months the organization releases a report on foreign direct investment (FDI), which falls under Canada’s balance of international payments.
At Invest in Canada, we see this release the same time as everyone else: at 8:30 a.m. (Eastern Time) on the designated morning. For the Q1 2020 results, that was yesterday—Thursday, May 28, 2020.
While the marginal increase of 5.4% relative to last year’s first quarter is certainly good news in light of the COVID-19 pandemic, we will now be keenly anticipating another date: August 27, 2020, when Statistics Canada releases the Q2 FDI numbers, reflecting the current April-May-June period.
It’s fully expected that the Q2 numbers will see a significant decrease in FDI. How much is to be seen.
As we pointed out yesterday, Canada is not alone in seeing a decline in FDI. For example, the United Nations Conference on Trade and Development (UNCTAD) projects FDI will be down 30-40% globally during 2020-2021. And the Organisation for Economic Co-operation and Development (OECD) suggests FDI flows are expected to fall by more than 30%.
With the Q2 FDI report release date coming at the end of August, we will continue closely following all the data.